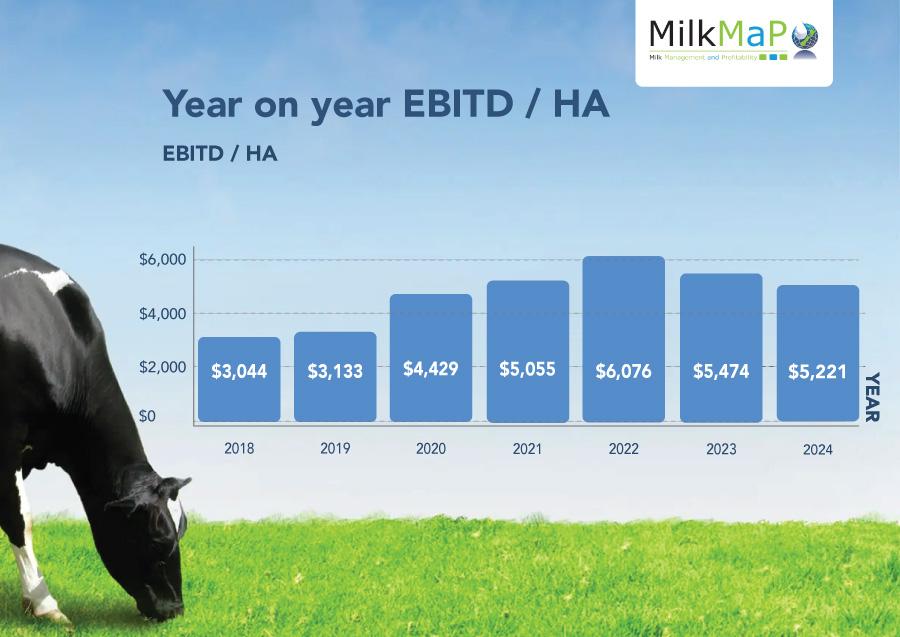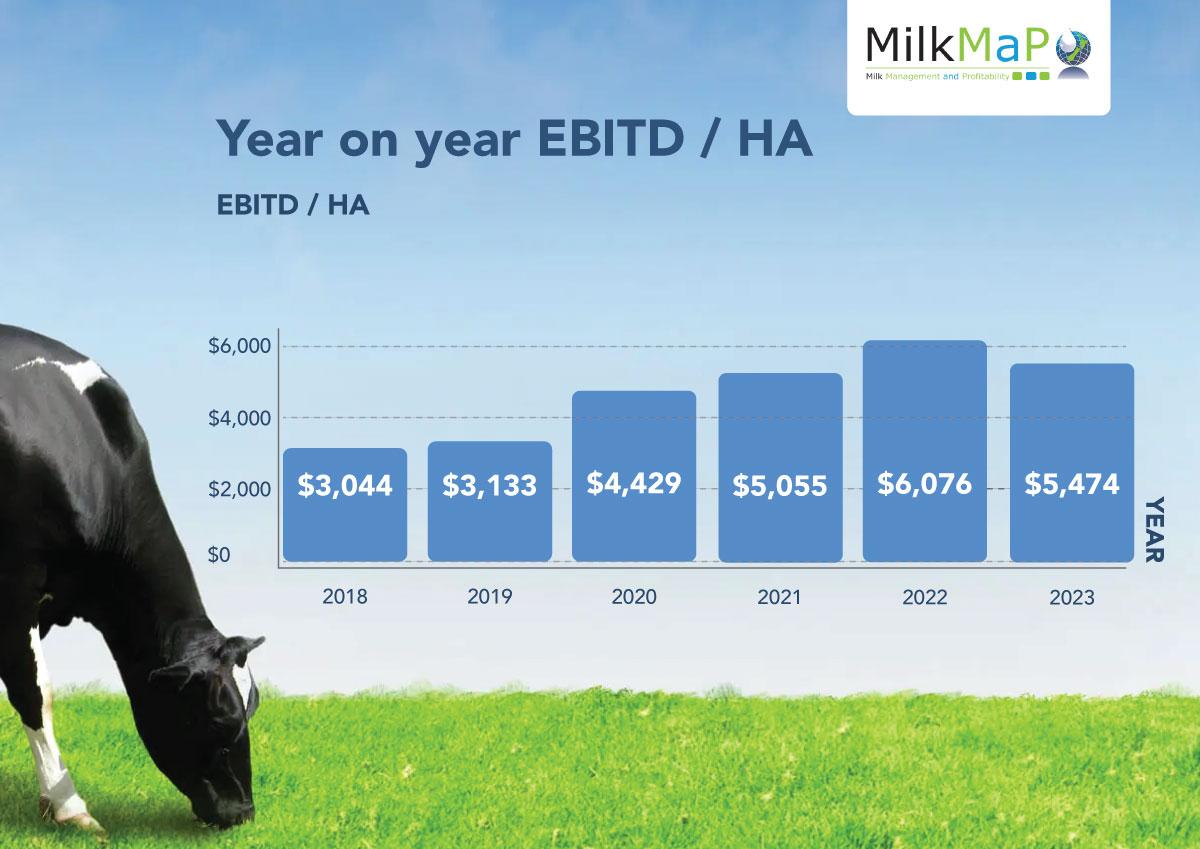


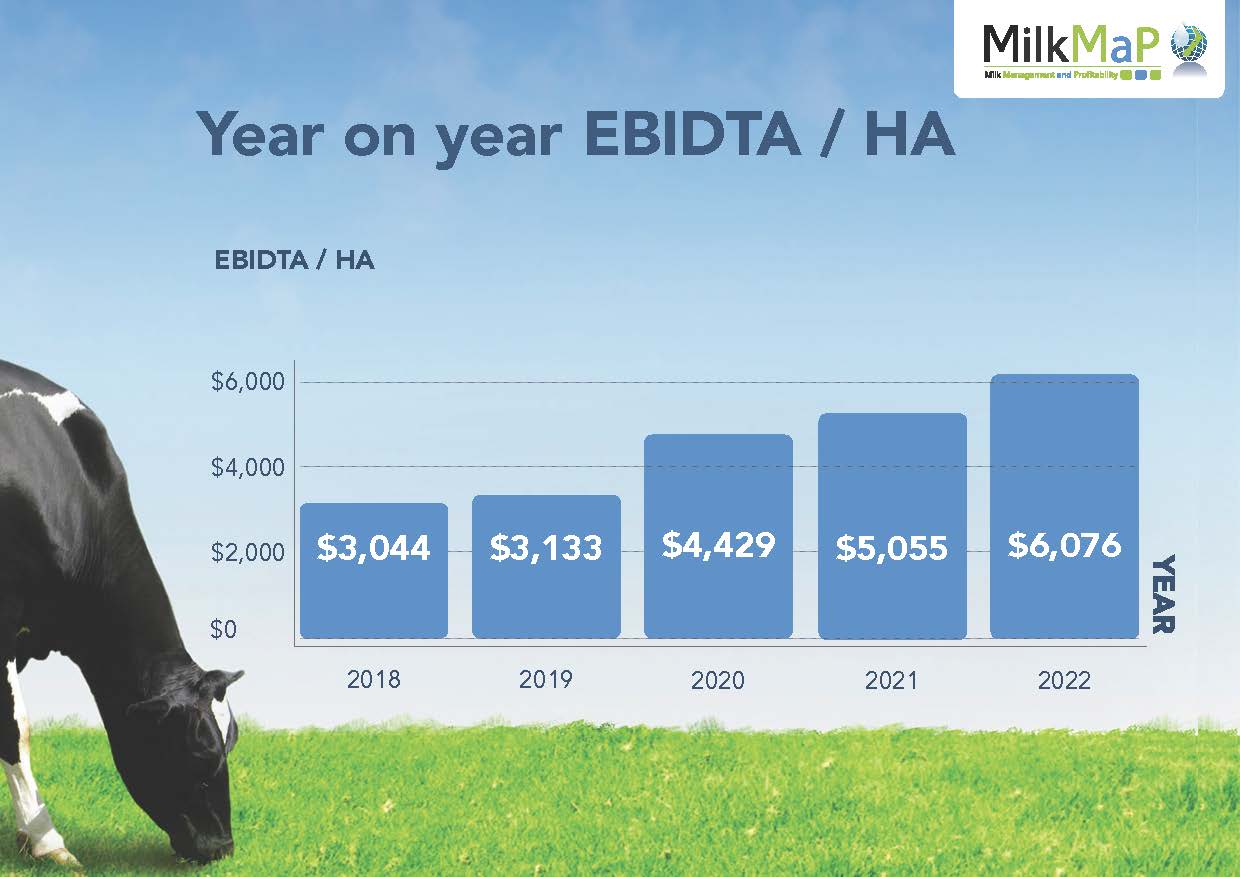
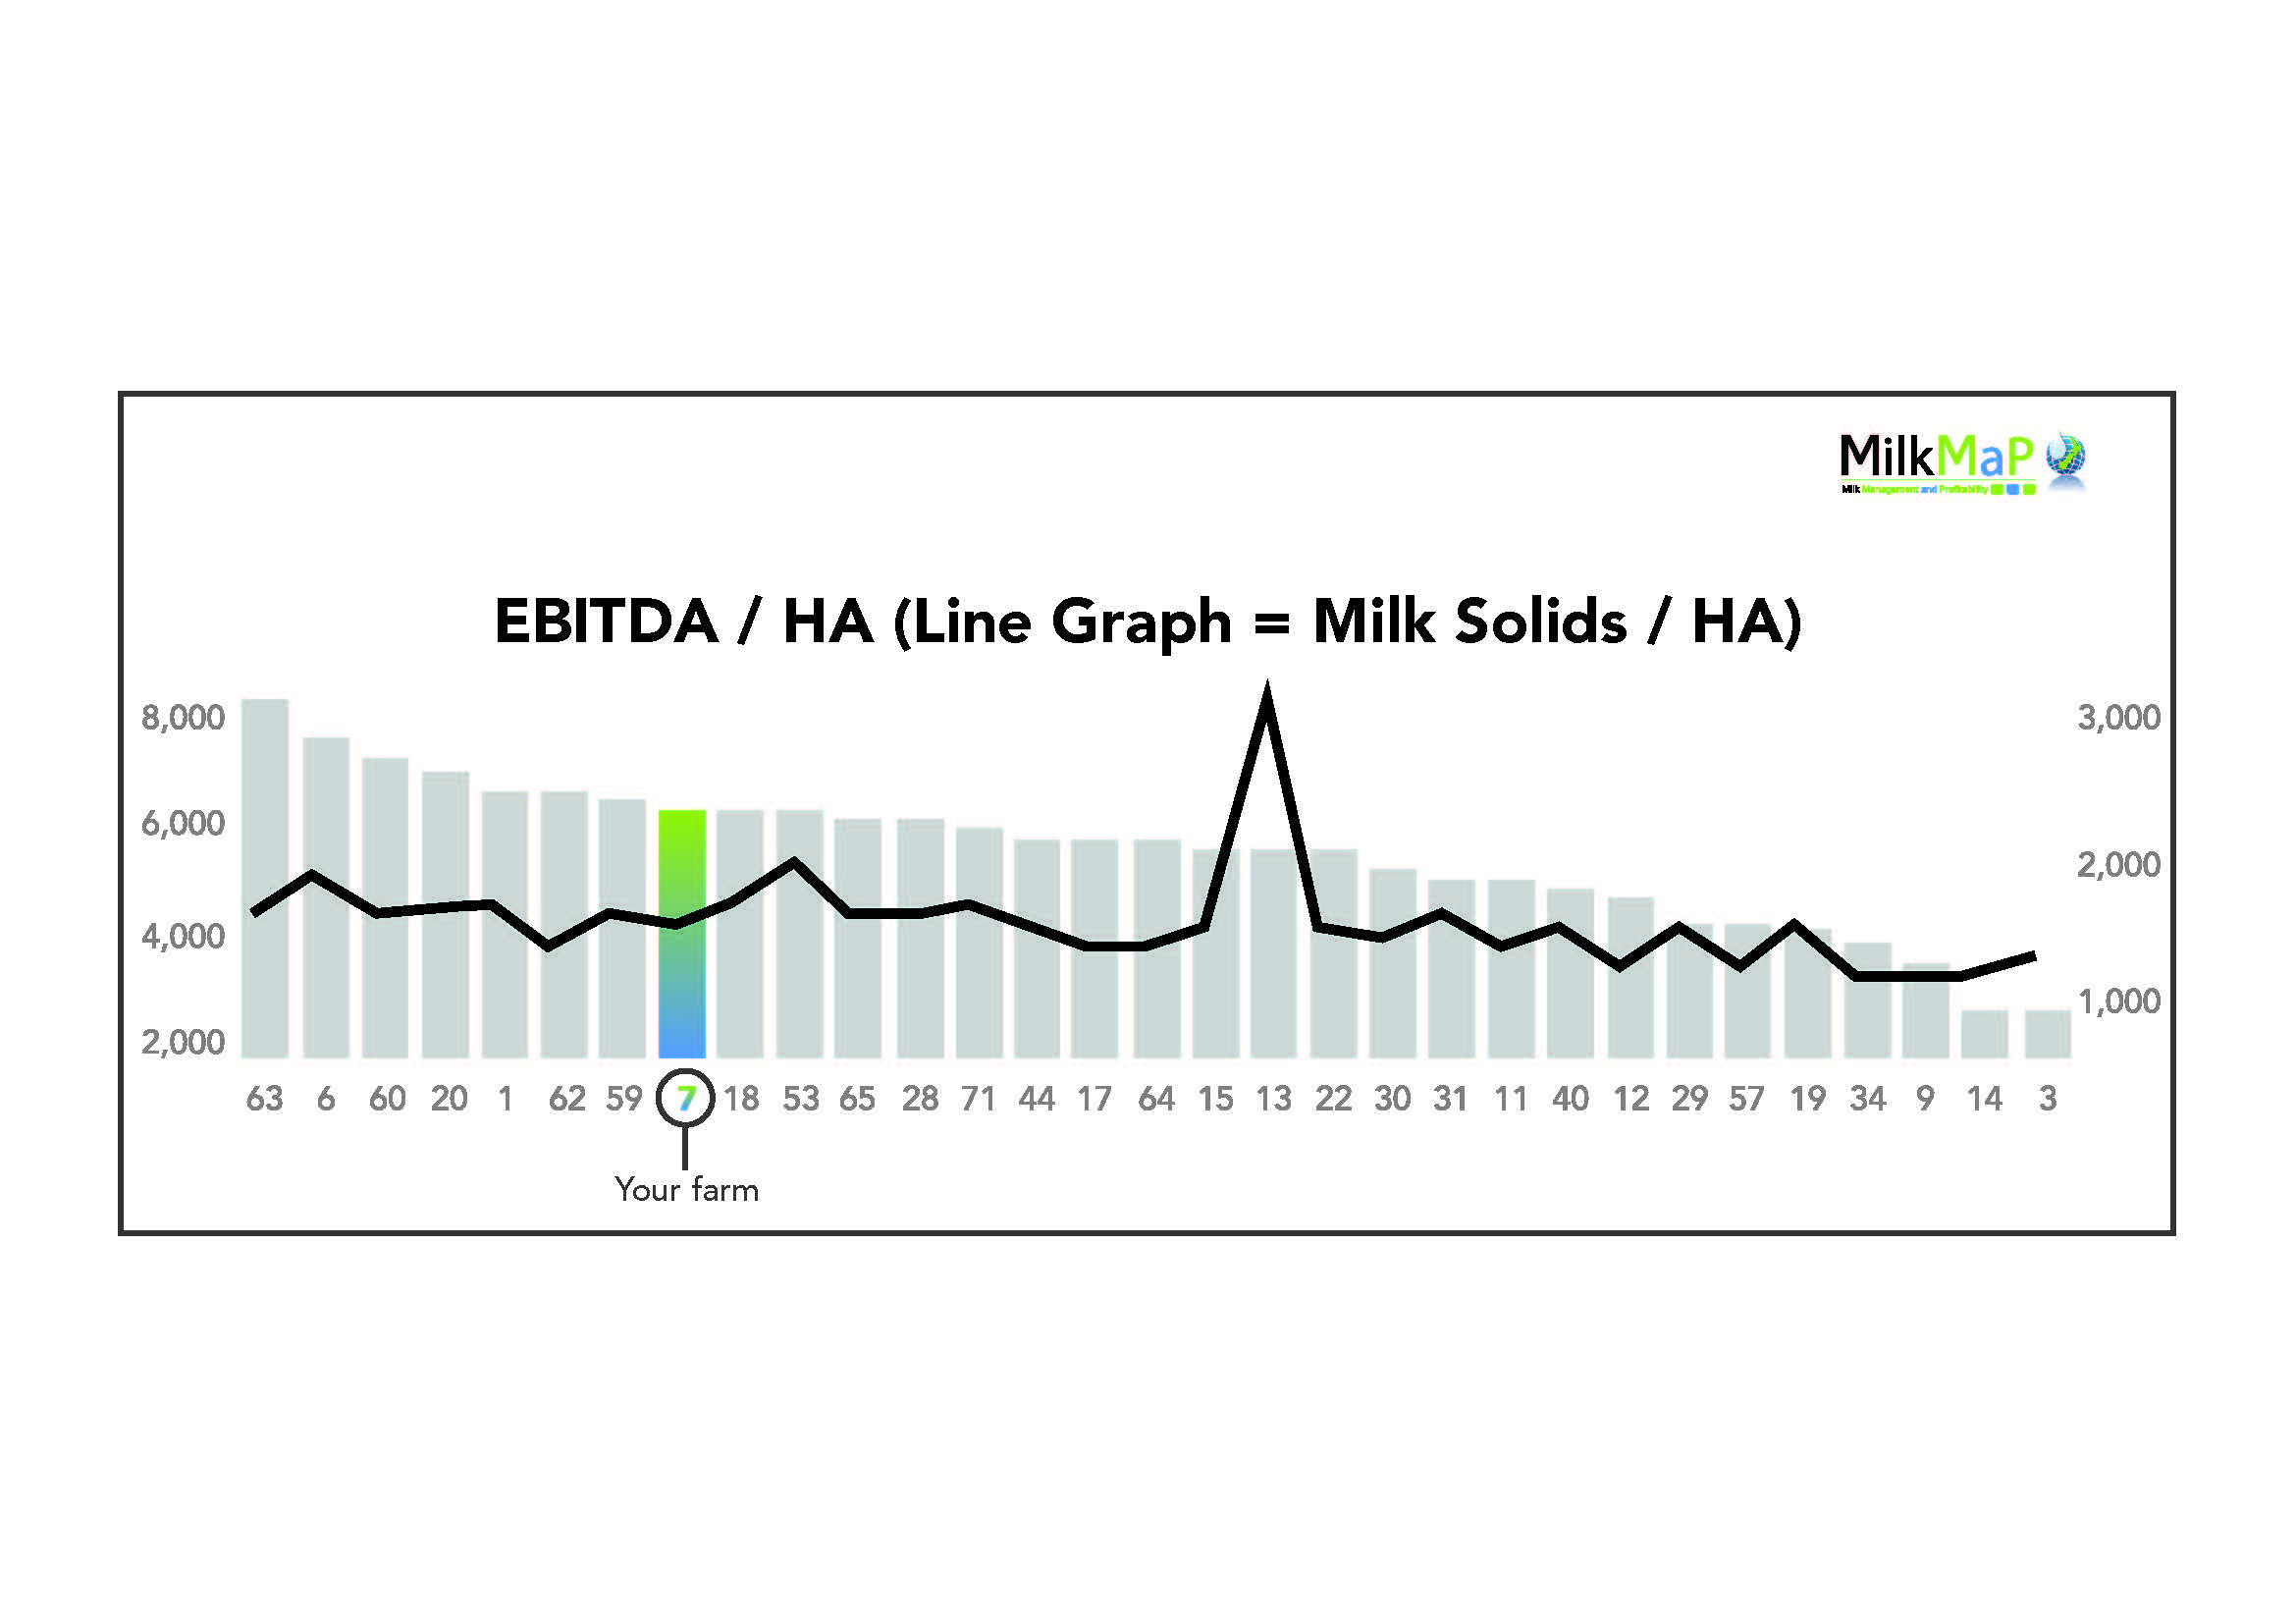
When all five feeding systems were blended within MilkMaP’s client-list, the overall average EBITD/ha lifted by 20.2% (up 7.2% on the season before) – from $5055/ha (2020-2021) to $6076/ha (2021-2022) – fuelled by a 23% increase in the milk price.
Rising costs fail to hold smart producers back
System 4* and 5 farms outperformed System 1 through 3 farms last season by an additional $1700 per hectare (finishing with $7000 per ha), according to MilkMaP Consulting.
MilkMaP focusses on “milk”, “management”, and “profitability”, by analysing its clients’ cost structures, and the impact of any proposed feeding or stocking-rate changes.
MilkMaP’s senior consultants have been tracking their clients’ results – throughout the country – for several seasons now. Its 2021-2022 end of year (EOY) summaries, include comparisons on all the main income/cost categories, the data breakdowns, the costs and profit (per hectare, per cow, and per kilogram of MS). The reports are visual and numerical, and show correlations between key performance criteria.
One of MilkMaP’s senior farm consultants, Cameron Burton, confirms that last season’s EOY numbers revealed that its clients’ earnings on System 4 and 5 farms (before interest, tax, and depreciation – EBITD/ha) lifted 28.5% (on average) to $7000 per ha. It compared to a much more modest lift for the System 1 to 3 farms of 7.8% to $5300 per ha.
When all five feeding systems were blended within their client-list, the overall average EBITD/ha lifted by 20.2% (up 7.2% on the season before) – from $5055/ha (2020-2021) to $6076/ha (2021-2022) – fuelled by a 23% increase in the milk price.
“The numbers demonstrate the responsiveness of the farmers on System 4 and 5 feeding systems to the increased profitability of feeding their cows well through the high pay-out,” Cameron said.
Fears eased
He says it also quietened the overriding fear that rising on-farm costs, nitrogen-capping and climbing interest rates would off-set the positive payout.
Cameron says, “Even with increased feed costs, the profitability of keeping these cows fed and producing well was identified at the time as still being more economical than the long-term averages, and these results show exactly what those gains were for those farmers.”
“Sure, we’ve had a really big increase in costs, but feed costs were unchanged proportionately, so the profitability of feeding cows improved. It has allowed us to increase our milk income and largely maintain our milk production [despite the cold spring and Nitrogen cap]. The economics of feeding cows has improved.
“We had our expectations that was the case, and we know how the research lines up with feeding, but perhaps we didn’t expect to see this level of difference between the systems.”
Yield dilutes costs
Cameron said to have the numbers fall out the bottom – given the big moves in income, expenditure, and marginally falling production – carries important validations farmers need to hear.
“Especially with how upset farmers were when they were looking down the barrel of increasing costs through the year,” Cameron said. “They were telling us, ‘we’re getting paid more but we need that because our prices have increased so much and it’s only just off-setting our costs, so we’re not actually going to earn anymore’. But what we can now see is that the farmers on average earned an increased EBITD of an additional $1012/ha.
“To put that into perspective, on an average farm of 700 cows at a stocking rate of 3.7 cows per ha on 190ha, it adds an extra $192,280 EBITD. It proves that the producers who were able to capitalise on the improved milk price were rewarded – because the costs increased less than the milk price.
“It is worth noting that interest rates are up 100% (from 4% to 7-9% for some farms). Depending on personal equity, some of that income will be absorbed to pay interest. But without the income, they would have been in a more worrying position.”
Spiralling costs handled
The spiralling farm costs – along with nitrogen capping – initially looked like they would load a lot of monkeys on everyone’s back.
Cameron said they had advised their clients through the season to hold the line, despite feed costs going from the low $300s a tonne to mid $400s, and grain costs lifting 80-90% from $400 to $700 a tonne.
“We were working with feed costs all season, and the milk price was increasing relatively faster than the feed prices, so it still had to be more profitable, and we had the numbers to support it. It’s been fantastic to see how it all washed out in the actual data.”
· 2020-2021
o FWE/kg of MS lifted 2.5%.
o EBITD/ha lifted 13%
o Milk price lifted 6.3%
· 2021-2022
o FWE/kg of MS lifted 19.72%
o EBITD/ha lifted 20.2%
o Milk price lifted 23%
In other telling numbers, feed costs (as a percentage of the FWE) trended downwards marginally from 22.49% to 22.41%. Other income (dividends and rebates) increased by 37.5% (because many clients received a Fonterra dividend for the first time in a few years).
Wages dropped from 17.16% to 16.14% of total FWE. Some of that has been attributed to more staff vacancies on-farm, and/or more automation. Stocking rates fell 1.2%.
Cameron confirmed the slow, cold start to the spring took a toll on production (down 5.10% per hectare – 2.5%kg MS per cow), which affected peak production and included some flow-on challenges with conception. The Nitrogen cap of 190kg/ha (high Nitrogen users historically peaked at 400kg/ha) had also challenged some of their clients more than others.
But there can now be no doubt that fortune favoured the bold.
MilkMaP senior consultant Cameon Burton says there is no doubt that fortune favoured the bold last season, and that there are clear signals for the rest of the 2022-2023 season.
What to expect
Cameron says there are clear signals going forward.
“I don’t think we’ve seen the full effects of reducing the Nitrogen we were putting on, because there would be some degree of Nitrogen in the soil that we are still able to mine from our higher input years so we’re still going to see a reduction in how much grass we can grow going forward. That will squeeze the stocking rate.
“Supplement prices are still relatively high, but the next big thing is going to be the interest rates. They don’t look like they are going to peak for another six to 12 months. If there are high levels of debt on-farm, it is going to be challenging to continue to profitably service that debt without some careful planning.
“The challenge is making sure you don’t spend money where you don’t need to, but there are going to be areas where high spending continues to be profitable.
“I think, the best advice I can give is to make sure the cows are fed, and you spend the money where it is going to deliver a profitable response and try to keep the high supplement prices in perspective. There is still money to be made there, even though you’re spending 25% more.”
He says MilkMaP’s assertion last season that System 4 and 5 farms are the way forward remains unchanged.
The 10-year average milk price in New Zealand is $6.57/kg MS (2010-20). The five-year average is $7.40/kg MS
The balance-point payout at which the level of profitability is similar between all systems is at $5.50/kg MS. That price-point has only happened twice in the last decade (and not in the last five years).
Cameron says using that 10-year average, means it still makes sense to build towards a System 4 to 5 to be profitable, and to stay ahead of potential animal welfare conversations.
“We need to stress that it’s not all about maximising MS/cow, it has to be within reason with the cows’ bodyweight and the farm’s physical resources. It’s how well you implement a system, which will truly be the measure of how profitable you can be,” Cameron said.
MilkMaP encouraged its clients to hold the line, despite rising feed costs lifting from the low $300s a tonne to mid $400s, and grain costs lifting 80-90% from $400 to $700 a tonne.
It resulted in Systems 4 and 5 producers being able to capitalise on the improved milk price because their costs increased less than the milk price.
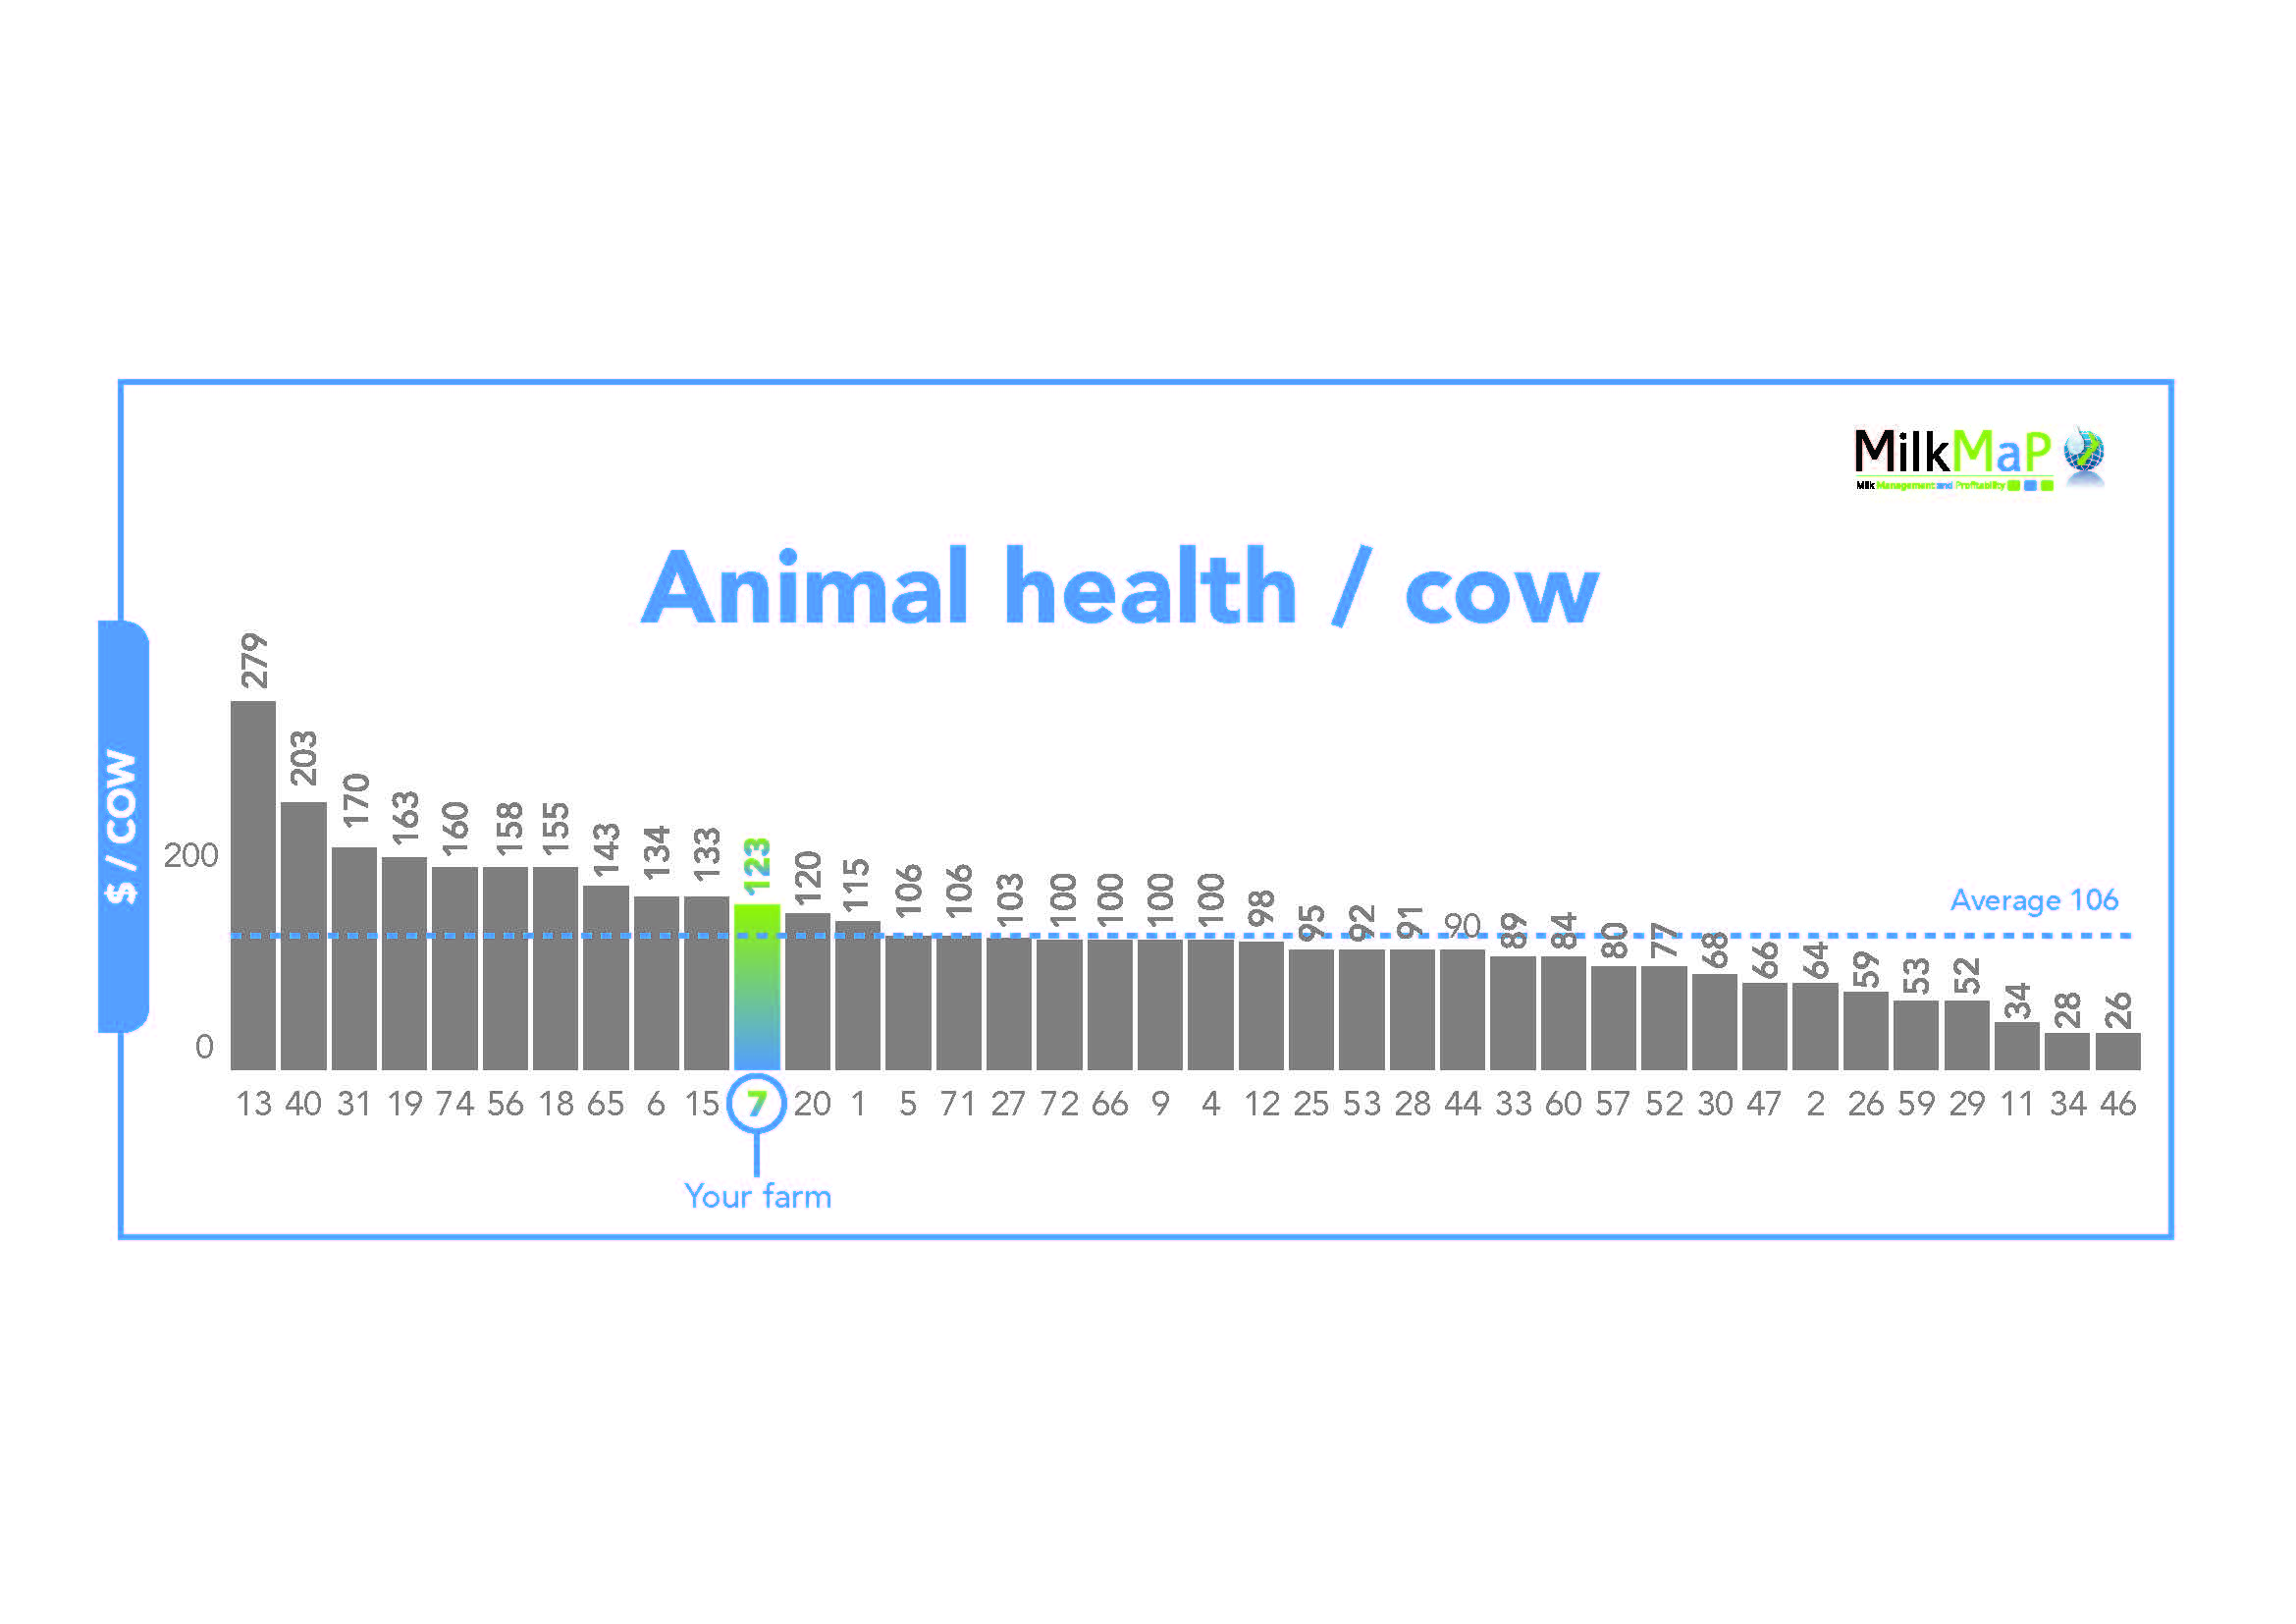
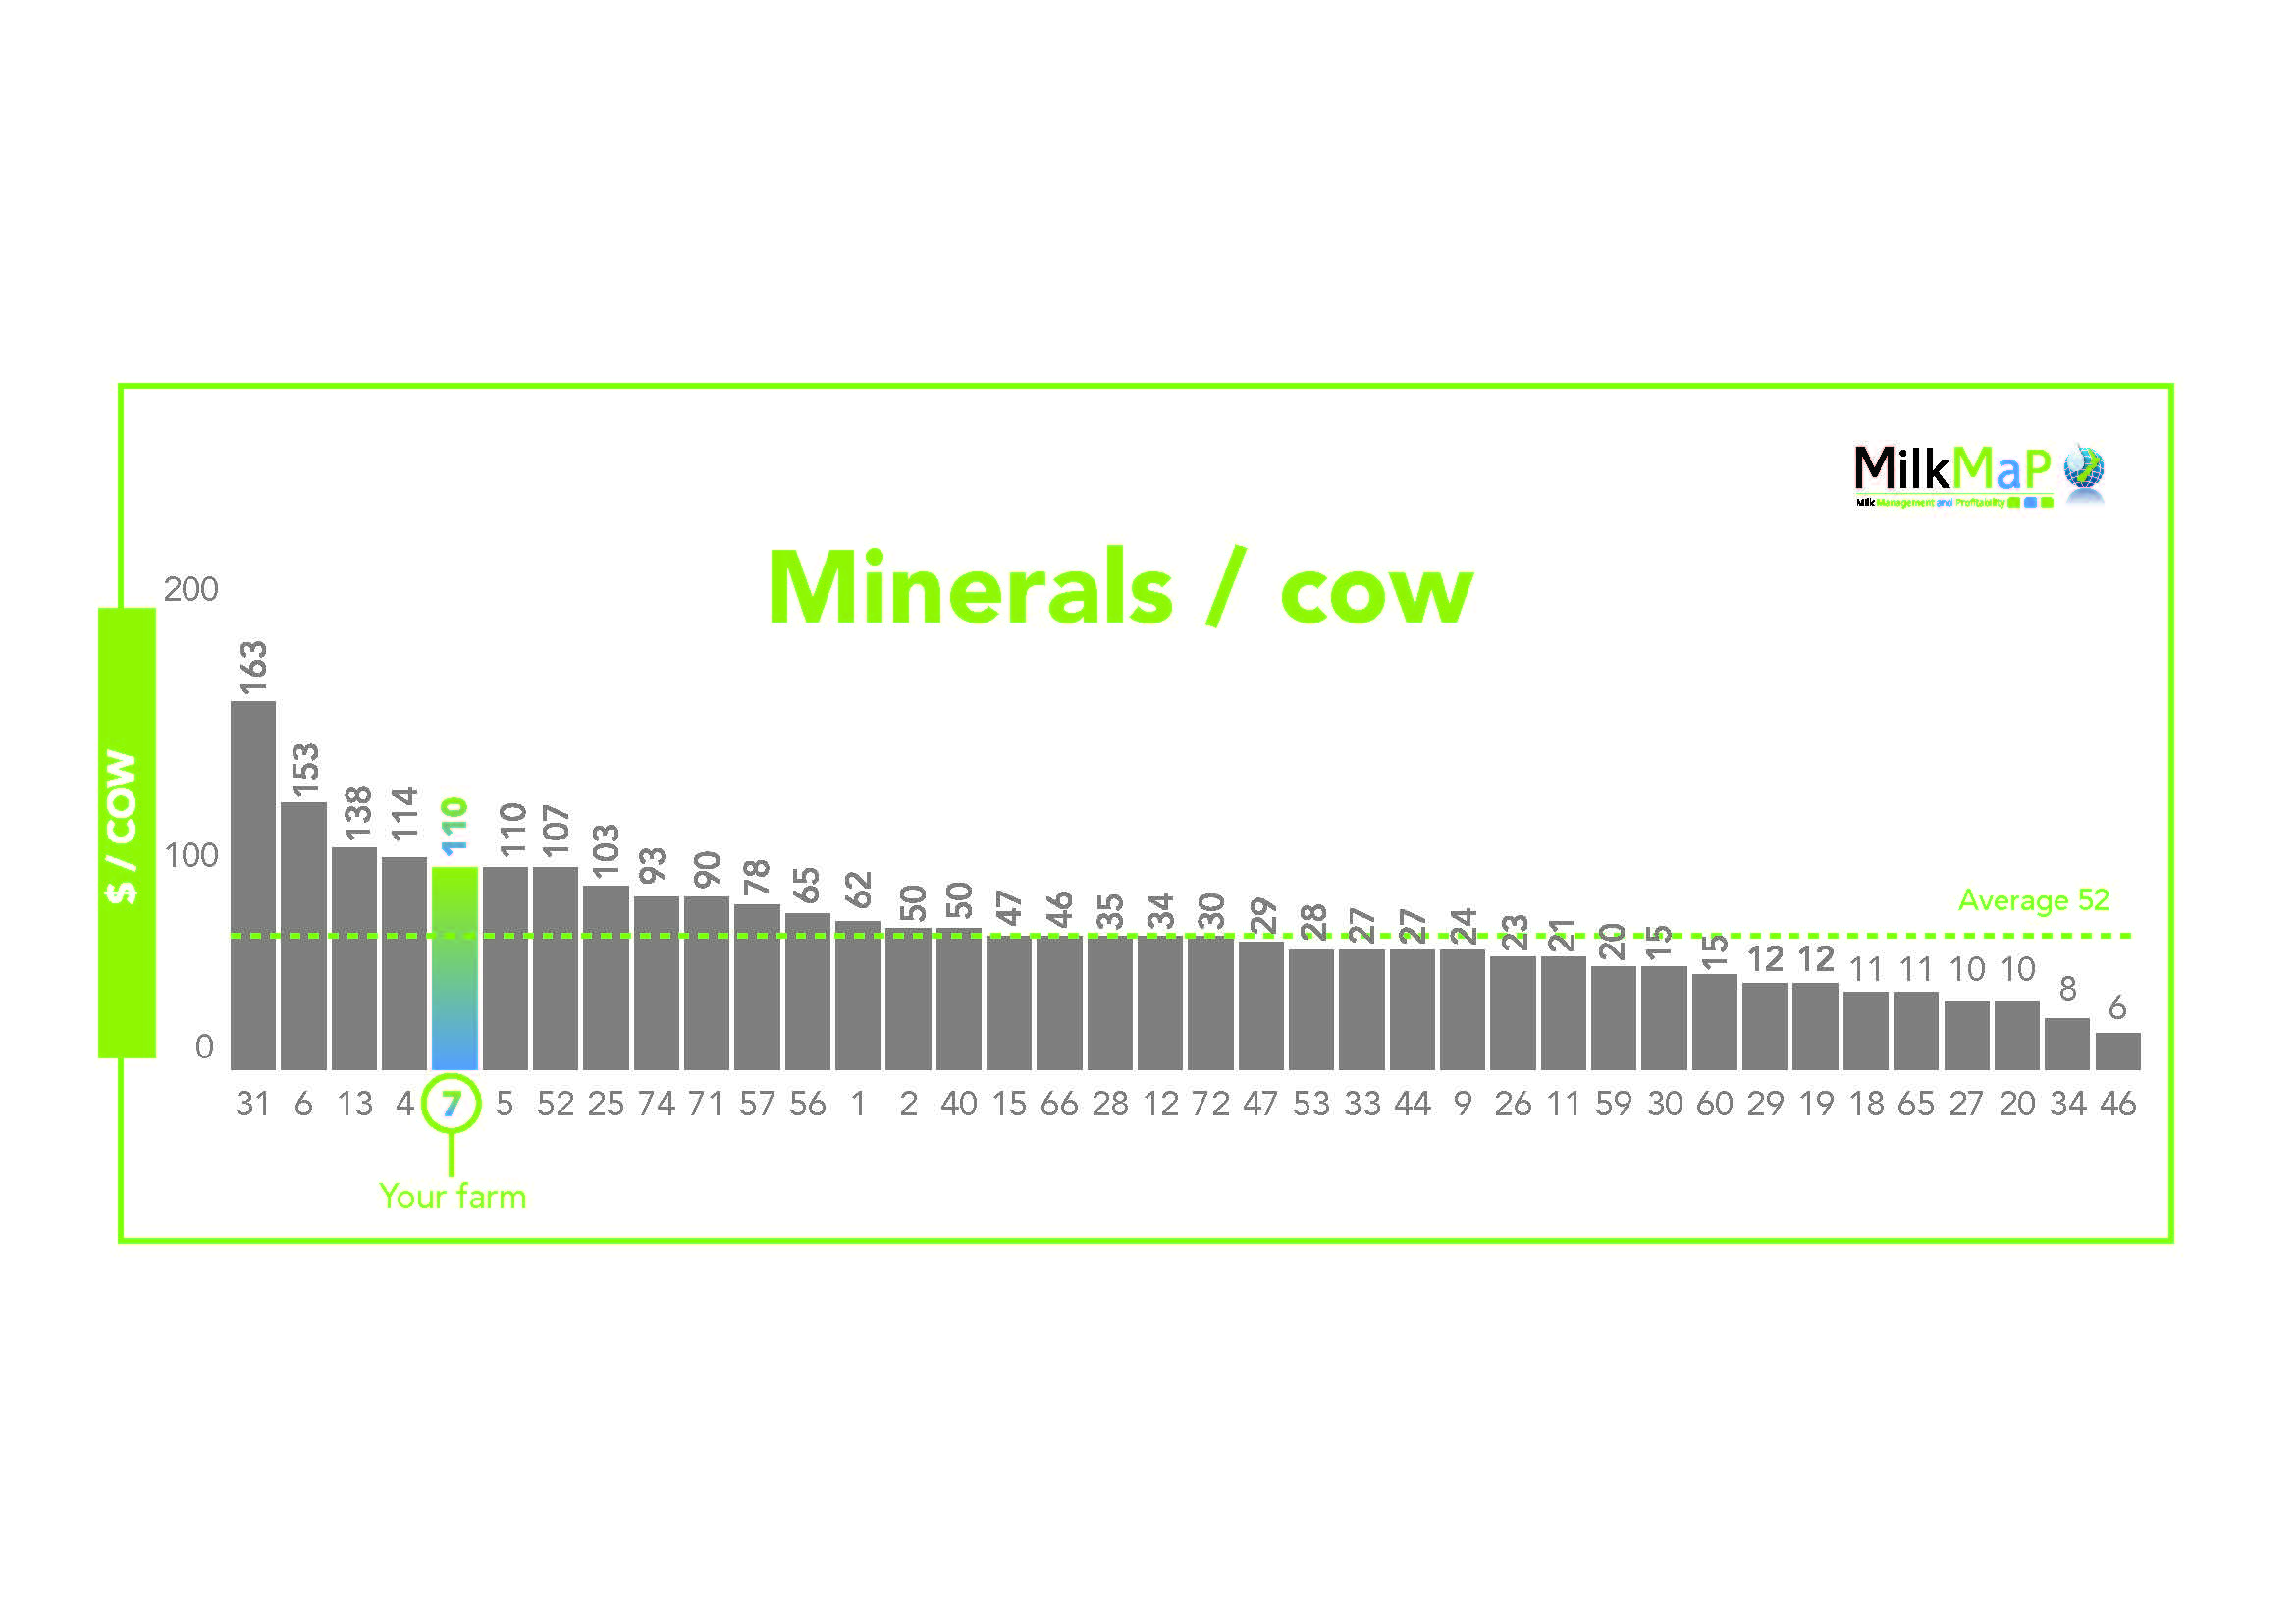
MilkMaP benchmarking
For some time, MilkMaP has been advocating that if cows are working close to (or at) their potential, it will lift production per ha. That, in turn, means more milk from fewer cows, which creates a more efficient system because there will be less per-cow fixed costs. Essentially, yield dilutes cost.
Fellow senior consultant Andrew Trounce agreed with Cameron, saying: “It’s about understanding the main profit drivers for our clients’ dairy businesses in a forever-changing environment. We use this summary to give our clients the scope to understand their own business within their own operation and against their direct peers.
“Information is power.”

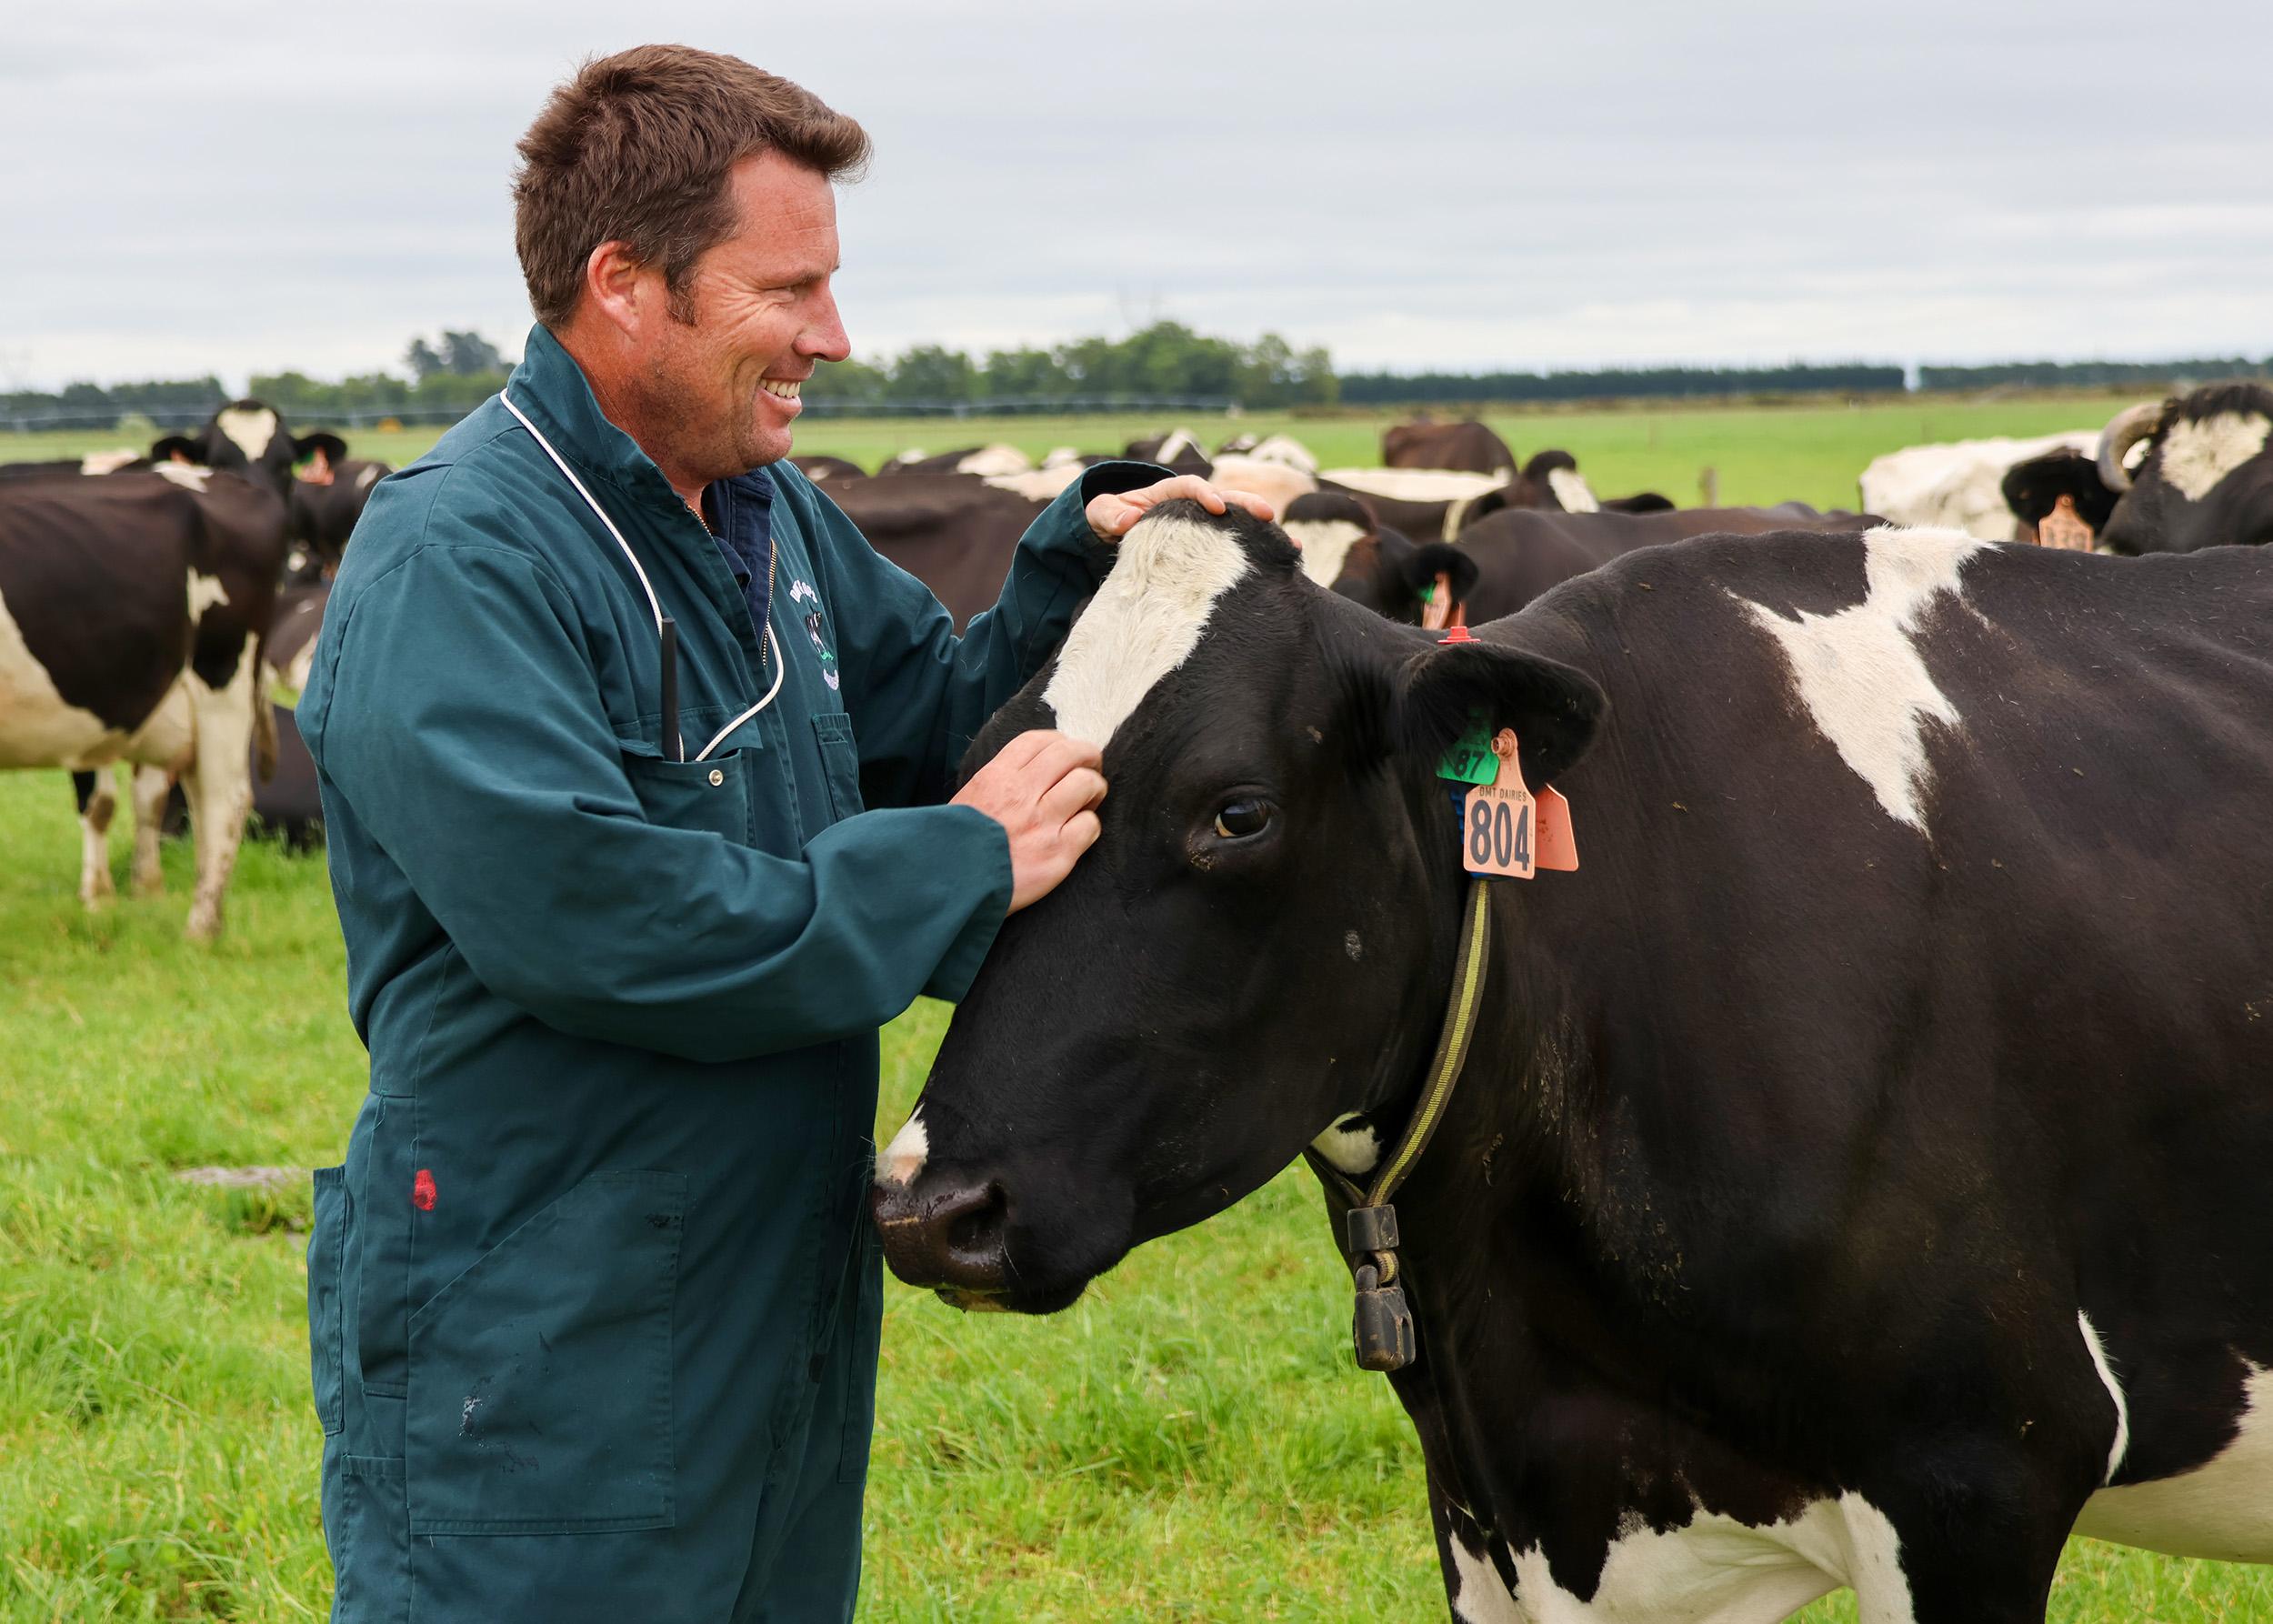
Cameron Burton, senior MilkMaP consultant.
Cameron Burton graduated with a Bachelor of Agricultural Science (First Class Honours) at Lincoln University. His Honours project focused on rumen function in response to feeding fatty milk by-products. He joined MilkMaP Consulting in 2014, and now oversees the company’s NIR feed analysis testing facilities. MilkMaP believes that maximising pasture growth – combined with the right supplementary feed when its needed – will help achieve better production outcomes and drive stronger financial results. Cameron was accepted to the Kellogg Rural Leadership Programme in 2023. For more information, please contact Cameron on: 027 445 3803.
*New Zealand farming systems explained (source: DairyNZ)
System 1 – All grass self-contained (all stock on the dairy platform) No feed is imported. No supplement fed to the herd except supplement harvested off the effective milking area and dry cows are not grazed off the effective milking area.
System 2 – Feed imported, either supplement or grazing off, fed to dry cows Approximately 4-14% of total feed is imported. Large variation in percentage as in high rainfall areas and cold climates such as Southland, most of the cows are wintered off.
System 3 – Feed imported to extend lactation (typically autumn feed) and for dry cows Approximately 10-20% of total feed is imported. Westland – feed to extend lactation may be imported in spring rather than autumn. *Note: Farms feeding 1-2kg of meal or grain per cow per day for most of the season will best fit in System 3.
System 4 – Feed imported and used at both ends of lactation and for dry cows Approximately 20%-30% of total feed is imported to the farm.
System 5 – Imported feed used all year, throughout lactation & for dry cows Approximately 25%- 40% (but can be up to 55%) of total feed is imported.