Without measuring it, how can you be sure?
By Dianna Malcolm
Numbers don’t lie, but which ones should dairy producers be listening to?
MilkMaP Consulting has just released its 2020-21 statistics for clients throughout the country. MilkMaP focuses on “milk”, “management”, and “profitability”, by analysing the business’s cost structure, and the impact of any proposed feeding or stocking-rate changes.
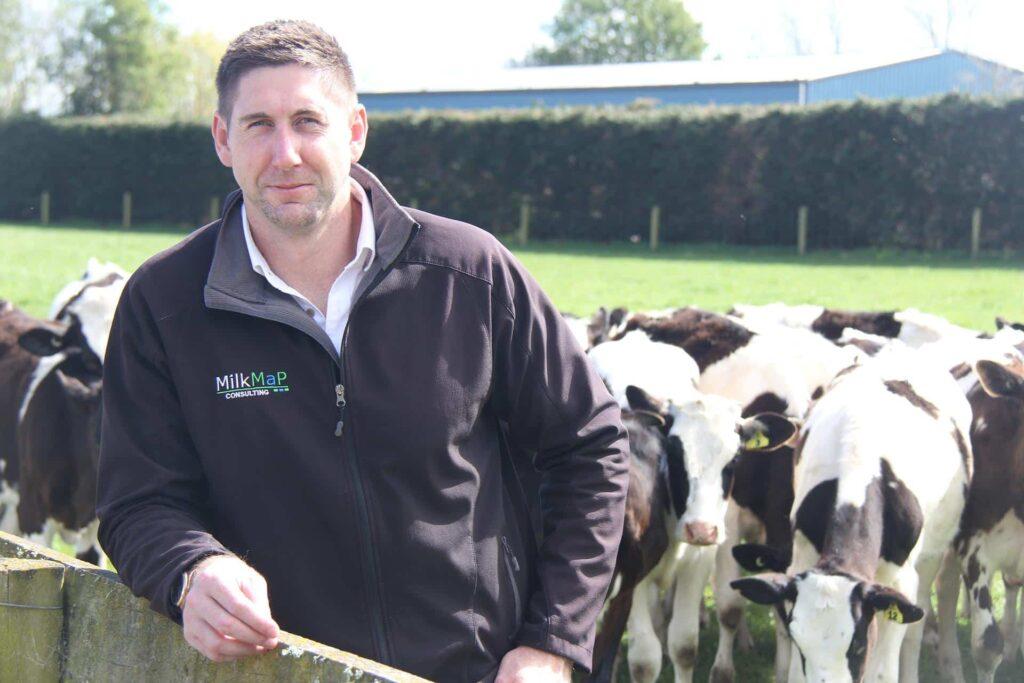
Its senior farm consultant Andrew Trounce has never dug as deep into the cost and benefits before, and his findings have thrown new light on some age-old debates.
Andrew was born and bred in the industry and has worked with cows his entire life. He blends his understanding of cattle, farming, and finances with how to get the best out of them for his clients.
Costs can be misleading
He says while the industry is heavily weighted towards keeping costs down, this season’s findings are telling him a different story – and it has a different ending.
“We 100% agree that good cost-control measures are important,” Andrew says. “But, it can be misleading to use farm working expenses on a per kilogram of milk solids [MS] as your only measure of profitability.
“Because, at the end of the day, you might have done a really good job keeping that number low, but it could be reflecting missed opportunity. You must ask yourself, ‘Does this cost contribute to improved production?’ And, ‘What other impacts could restrict it have on my overall result on everything from production to body condition score [BCS] to reproduction?’”
Andrew says the work that MilkMaP is doing is not only giving it a better understanding of its clients’ businesses, it is also giving its team validation for the company’s philosophy – that if cows are working close to (or at) their potential, it will lift production per hectare. That, in turn, means more milk from fewer cows, which creates a more efficient system because there will be fewer per-cow fixed costs.
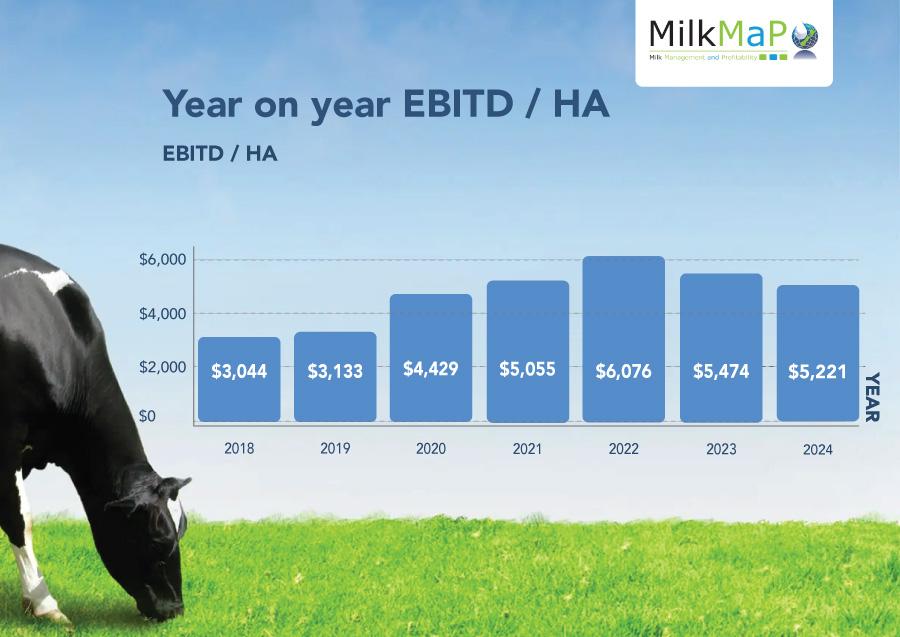
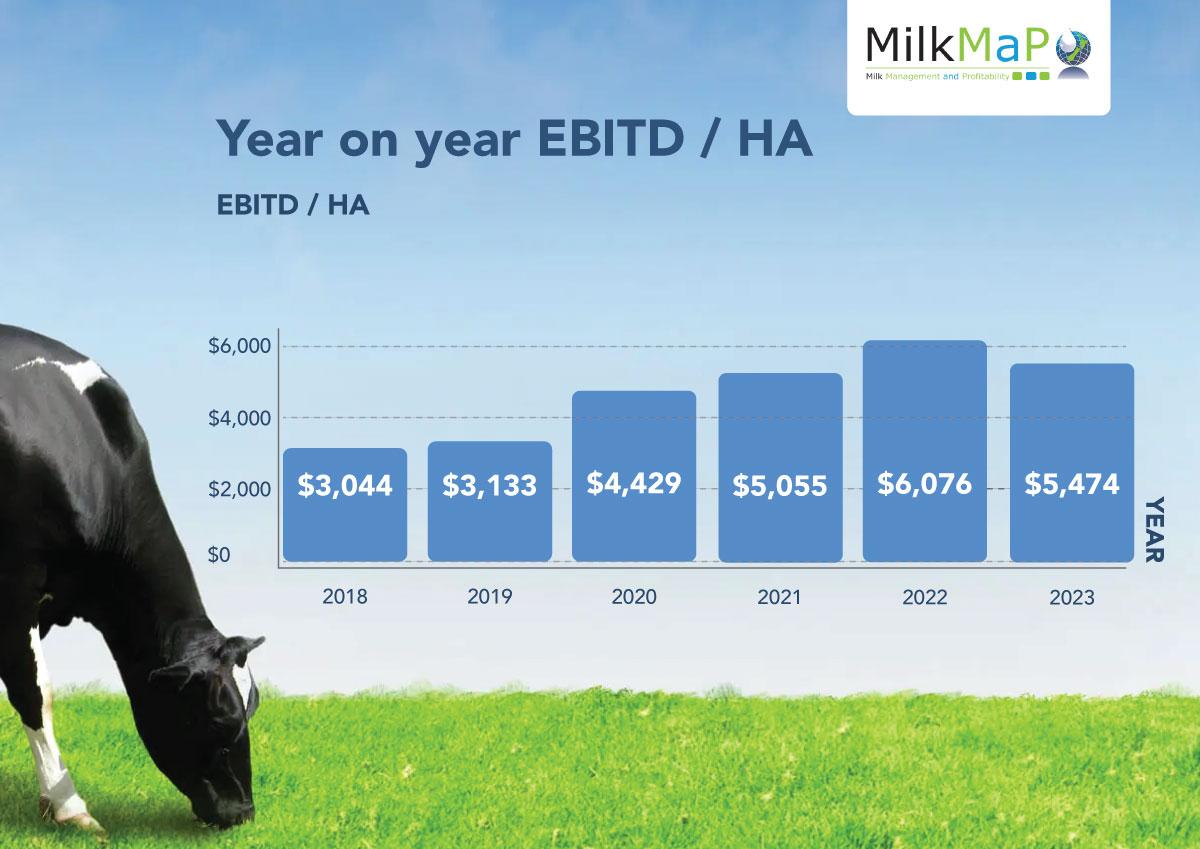
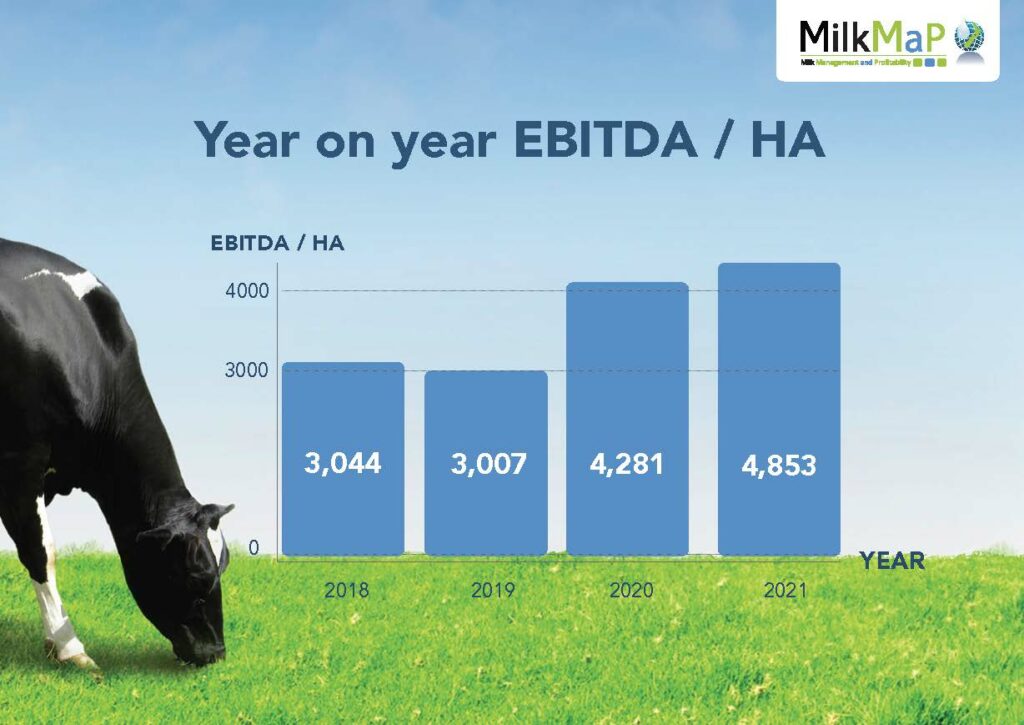
“If you own a farm your investment is in your land. Surely your measure of profitability should be against that hectare? So, how I look at it is, ‘What is our EBITD/ha [earnings before interest, tax, and depreciation]. If you have a big mortgage, you need to know if you’re performing on that basis.”
He says with increasing compliance and regulation, the need for solid cash flow in times of uncertain pay-outs is also critical.
“Especially, given that farm values are unlikely to see the gains made in the past two decades going forward because of new regulation. Creating efficiencies and having strong performance within your system will be vital.”
MilkMap benchmarking
“Other industry systems will give you a quartile result or an average, but they don’t give you an idea around the spread of the farms, or a true understanding of the total picture,” Andrew says.
“Each farm that has agreed to be included in this season’s summary is identified by a number, and they can look themselves up and also further refine that selection by comparing themselves to other farms that might be in the same region, might also have a run-off, have irrigation or not, or winter milk premiums. So, it is comparing apples with apples.
“It’s about understanding the main profit drivers for your dairy business in a forever-changing environment. We use this summary as a way to give our clients the scope to understand their own business within their own operation and against their direct peers. Information is power.”
To that end, MilkMaP supplies end of year summaries, which include comparisons on all the main income/cost categories, the data break downs, the costs and profit per hectare, per cow, and per kg of MS. The reports are visual and numerical and show correlations between key performance criteria.
Production/cow dilutes overheads
This year’s numbers clearly tell Andrew that additional and mindful production/cow dilutes overhead costs.
The 10-year average milk price in New Zealand is $6.26/kg MS (2010-20). The five-year average is $6.05/kg MS.
To achieve a more profitable system fully feeding cows at feeding systems 3-5, Andrew says the milk price needs to be above $5/kg MS. On the 2019-20 season milk price, system 3-5 farms achieved almost $1000 more/ha than the farms on a 1-2 feeding system.
“This tells me – going on that 10-year average – that you should build your system towards a system 3 to 5 to be more profitable.
“We need to stress that it’s not all about maximising MS/cow, it has to be within reason with the cows’ body weight and the farm’s physical resources. It’s how well you implement a system, which will truly be the measure of how profitable you can be.
“It’s helpful to know how you got there. Farmers who might not be doing as well might wonder, ‘Are we spending a lot, or are we not producing enough so we can’t dilute our
costs? Or, are we not investing enough into regrassing to grow the pasture required each year?’”
Production linked to profit
MilkMaP believes that maximising pasture growth – combined with the right supplementary feed when its needed – will help achieve better production outcomes and drive stronger financial results.
“We understand that grass is king, and we understand all the other parts of that conversation that drives optimum profitability.”
Last season MilkMaP’s clients, on average, lifted their production by 48kg MS/ha (+2.95%), in addition to a 19kg MS/cow increase (+3.93%).
Andrew acknowledges that – for the most part – their clients are more weighted towards 3-5 feeding systems.
“Farm working expenses/kg of MS are up by 2.5%. Without that extra production/cow and per hectare it would have been an increase of 5.5% in farm working expenses. Overall, the farms had a 13% increase in EBITD/ha; half of which is fuelled by the 6.3% increase in the milk price.
“As inflationary pressure continues on products used on-farm, and in the service industry, what we’re seeing is a greater need to dilute overhead costs. If we stand still, those costs will keep creeping up and eat into the profit.”
Getting it right
Andrew says MilkMaP goes through their client’s accounts and aligns all their cost categories to MilkMaP’s own chart of accounts, so the information is accurate and meaningful.
“Most farmers accounts code items slightly differently, so it is important that we take the time to align these items.
“A point of difference in our benchmarking is that we separate out mineral spends and put it in its own category. Because often those costs are hidden in another category and farms then don’t know if they are over or under-spending in that area.
“By being proactive with animal health we can achieve drastically different outcomes.”
Results validate the philosophy
Andrew says every year as they dig deeper into their data they are getting stronger background numbers, supporting the principles MilkMaP believes in.
“The take-home message I’m seeing is that by understanding your costs and knowing your key profit drivers [i.e., production/cow and therefore/ha] you can deliver the best level of profitability for your farm.
“And, unless you know the data and you’ve seen the analysis, it can be very hard to stay on top of it.”


