

Things don’t have to be perfect to be positive, Andrew says.
He has been boiling down what the financial optics mean for New Zealand’s dairy farmers this season.
Straight up was the reality after announcing a lower milk price for the second successive season, Fonterra and some other milk companies paid a higher-than-normal advance rate – which helped cashflow in a tight year.
That advance rate last season insulated farmers to the equivalent of a $8.20-$8.40/kg Milk Solids (MS) price. In a stroke of fortuitous timing, the expected reduced retro payment was softened by the current season’s positive $9 forecast, and that the advance rates are running higher than previously paid rates.
How 2023-2024 played out
MilkMaP tracks 20 cost-categories across their clients’ businesses, which all contribute to FWE and EBITD/ha summaries.
Andrew says in 2021-2022 15 of those categories moved up by more than 5%.
The 2022-2023 season included 16 categories moving up by more than 5%. Just two categories moved by under 1%, and two moved by less than 5%.
“In comparison, the 2023-2024 season had only seven categories with a movement of greater than 5%,” Andrew said. “So, we’ve just seen a huge settling across the board in the data, where there haven’t been the surprises we’ve had to deal with in recent years.”
Andrew says the steadying of those markers made budgets more durable.
“The true description of the year is that we’ve seen that agflation from the previous two seasons stabilise,” Andrew said.
Easing expenses not enough to offset milk income
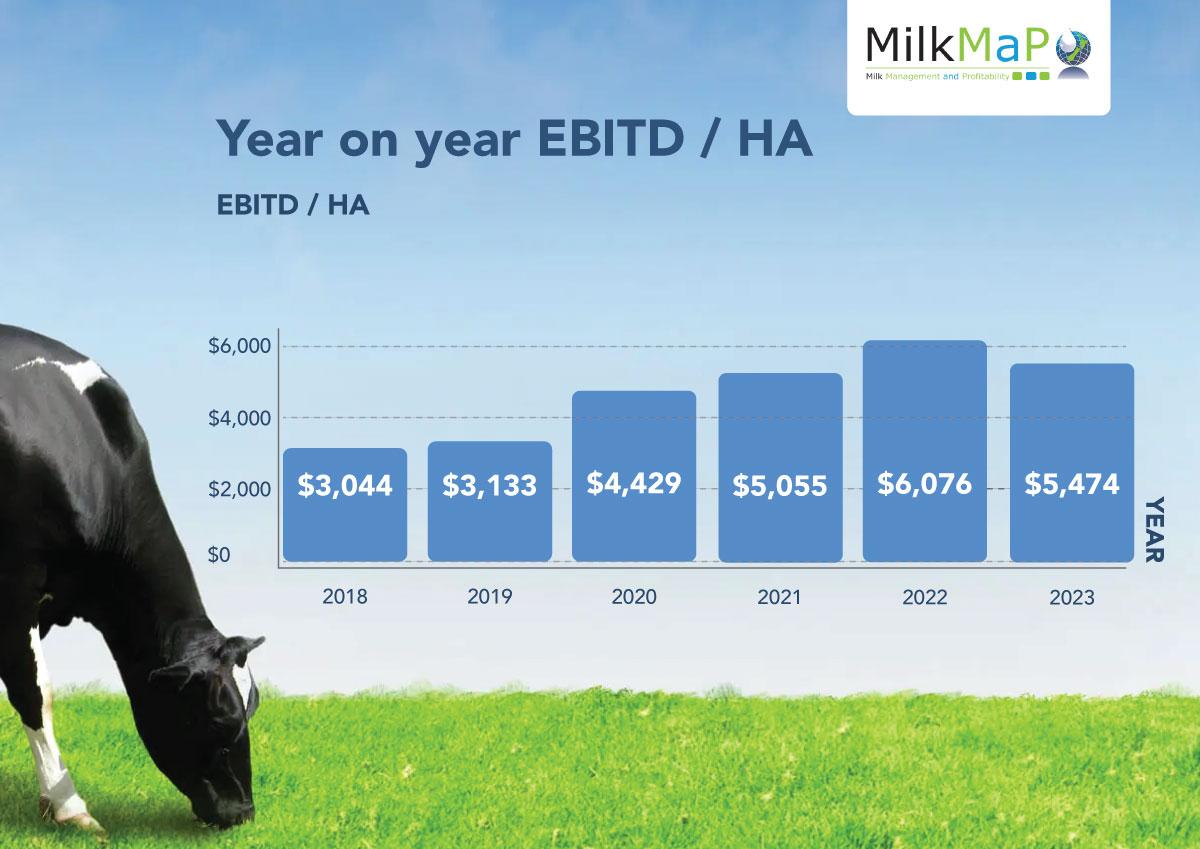
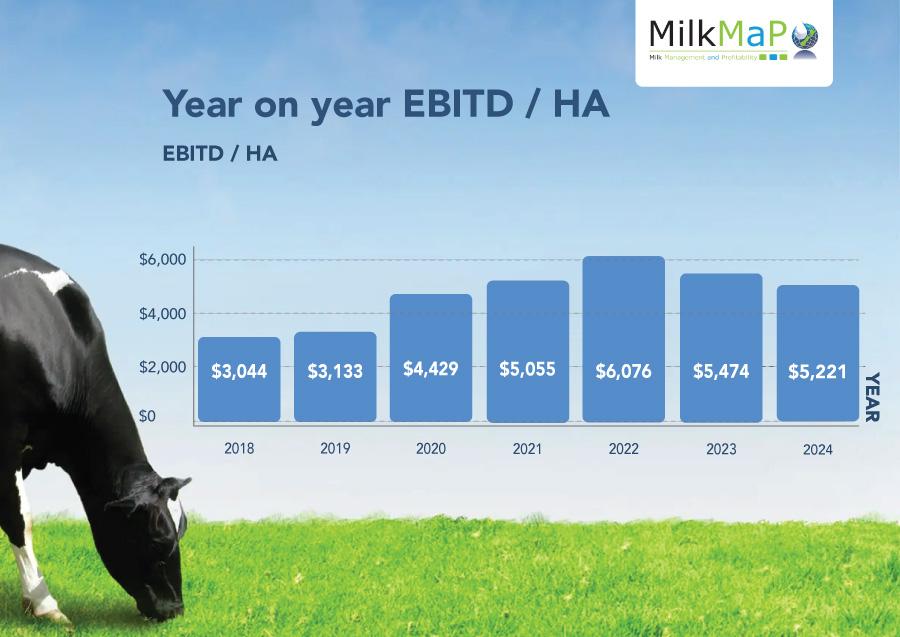
EBIT/ha dropped 6% to $5221/ha [2023-2024], but it wasn’t enough to offset the drop in milk income.
Meanwhile, within the overall FWE [2023-2024] the amount of purchased feed was down 9%, feed crop grown was down 5%, and fertiliser spends were down 18%.
The biggest increase in FWE year-on-year was irrigation, with the average spend lifting by 29% – which came through in power charges. It is significant within the bigger story because the total FWE absorbed that lift – and, still dropped 3%.
Dropping purchased feed costs was helped by competitively priced feed options and offset by inter-regional variation with supply and demand of pasture growth.
“Autumn got cold really quickly, we were dry through the summer, and the spring wasn’t that great either. Also seen was a net gain in stocking rate of 1%, therefore the drop in feed spend wasn’t a result of increased pasture harvested per cow”
Knowledge is power
He credits their clients with a solid understanding of what their cows need.
“There is a lot of knowledge now around what feeds should and shouldn’t be used at different times of the year. I think that’s where we find a lot of our value on-farm being part of the discussion and making sure that the right feed at the right time gets the right outcome.
“Whether its production, condition gains, cows in-calf, where we are within the season – to where we should be for that time or year. It’s also about the quality of the pasture that’s being grown, the stocking rates, and how we piece it all together to get a good outcome.
“We’re never just looking at a single aspect. It’s more, ‘If we pull this lever what could be the direct and indirect consequence of that?’ And, are there more pros than cons to doing so?”
Production per cow and per ha lifted
In the 2022-2023 season, the stocking rate had dropped 3% to 3.39 cows/ha. In the 2023-2024 season it lifted to 3.43 cows/ha.
“It isn’t a big movement, but it’s an interesting sign that potentially some farms had run some lower cow numbers, and had replenished their herd a little bit to what they feel is their status quo,” Andrew said.
Average MS/cow production lifted 1% from 492kg MS per cow to 497kg MS per cow. The stocking rate and production lift was cumulative.
“Based on that 1% lift in stocking rate – together with the 1% lift in MS per cow – we achieved a 4% lift in MS per ha, giving us an average finish of 1720kg MS/ha.”
“Because those production metrics have all lifted slightly, it means that the EBIT/ha (being down 6%) was offset slightly from the income (milk price) being down by more than that.”
Diversification in the mix and banks invested
Diversification has also become part of the conversation. Last year, other farm income made up 46c/kg MS. It included side revenue streams such as a beef units, dairy grazing, or (for example) Fonterra dividend payouts.
Andrew says the data being processed by the MilkMaP team has fortified the budgets its clients are presenting to their banks.
“Because we can take real life results across a decent data set, and then apply it to our forecasting software which includes cow biology, calving spread, and the next level degree of detail to get that nailed in forecast for each new season.
“It’s made it simpler – or more predictable – and, in the current market we’re able to construct budgets that will stand the test of time. That appears to be really helping the banks we routinely work with to feel confident with those numbers.”
Positive mood
Andrew says the general mood on-farm this season among their clients is positive.
“The stars are really aligned right now, and farmers are getting in and getting things done and seeing some good early growth in parts of the country – especially in the Wairarapa and Canterbury.
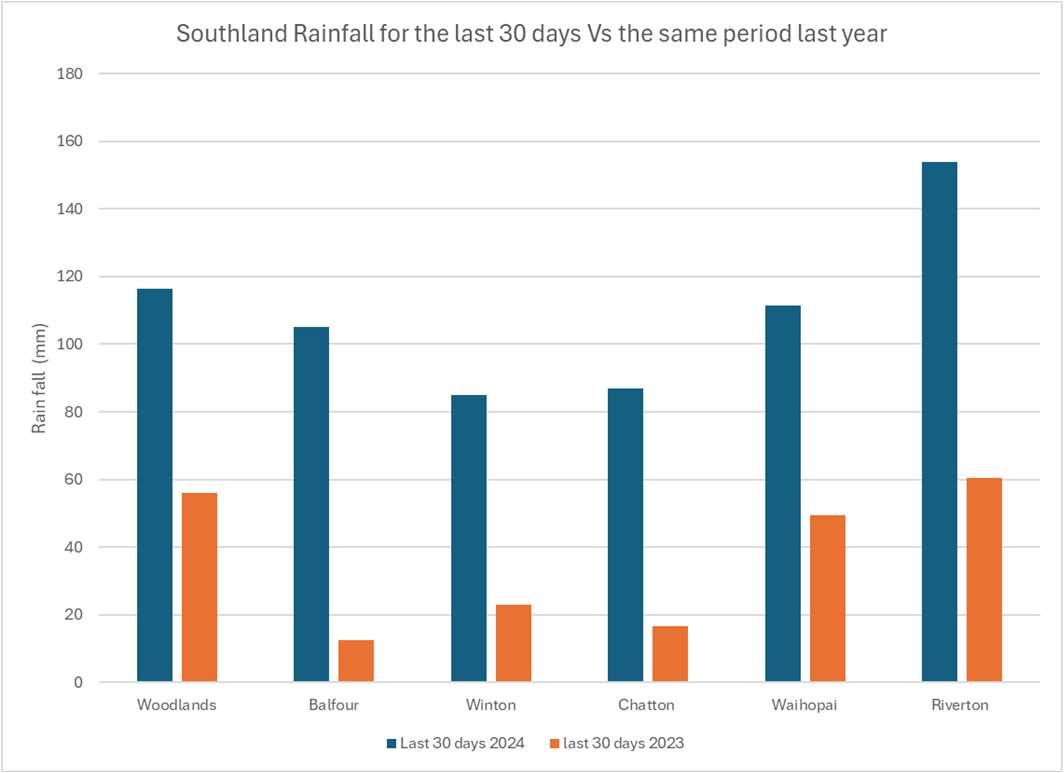
“Southland has had a tough start to the season because they are extremely wet. But production from the collective client base has really starting out strong, no matter the location.
“Our clients have their cows in good condition, they’ve ticked a lot of boxes, and they feel like they are ready for this season. They are just eager to watch that production climb to peak milk through October.
“They are dialled in with a focus to achieve the outcomes that they’ve spent the last six months planning for.”